
Wednesday 5/17/2023
extra lesson on how to use levels
Intro
Tuesday
SPY low volume, neutral. Keep watching “2 Ton Tilly”. Very important level.
QQQ new level, watch 328.5.
Macro trend neutral on down day. Could be dip buying.
Realtime prints high volume TLT META (again)
Close prints high volume AMZN MSFT at the highs.
I have a longer term bearish outlook due to megacap prints at the highs. Short term, the data isn’t telling. I tend to think we bounce in the next few days for a much larger distribution at a higher level.
Wednesday
Tonight I’m going to walk through an example of using the data provided in this newsletter for a trade. Please understand this isn’t an alert service, and I don’t recommend particular trades. The best way to use the newsletter is to integrate my levels and bias into your own trading strategy. I’ve been watching the darkpools trade for several years and know when it looks normal or they are up to something.
Last night I thought they were up to something and wrote this:
The boys could be doing a couple of things. First is de-risking ahead of a volatility event like the US Debt Ceiling. Or they could be buying for a run up. I don’t have time to analyze all these trades tonight. Most of the time, prints like these are a bullish sign. Most of the time.
I said “most of the time” and spelled out a bullish thesis twice. I’ll never say “the market is going up tomorrow”. Mainly because anything can happen, and these guys can make the market go up and down by pushing a button. I can also be wrong.
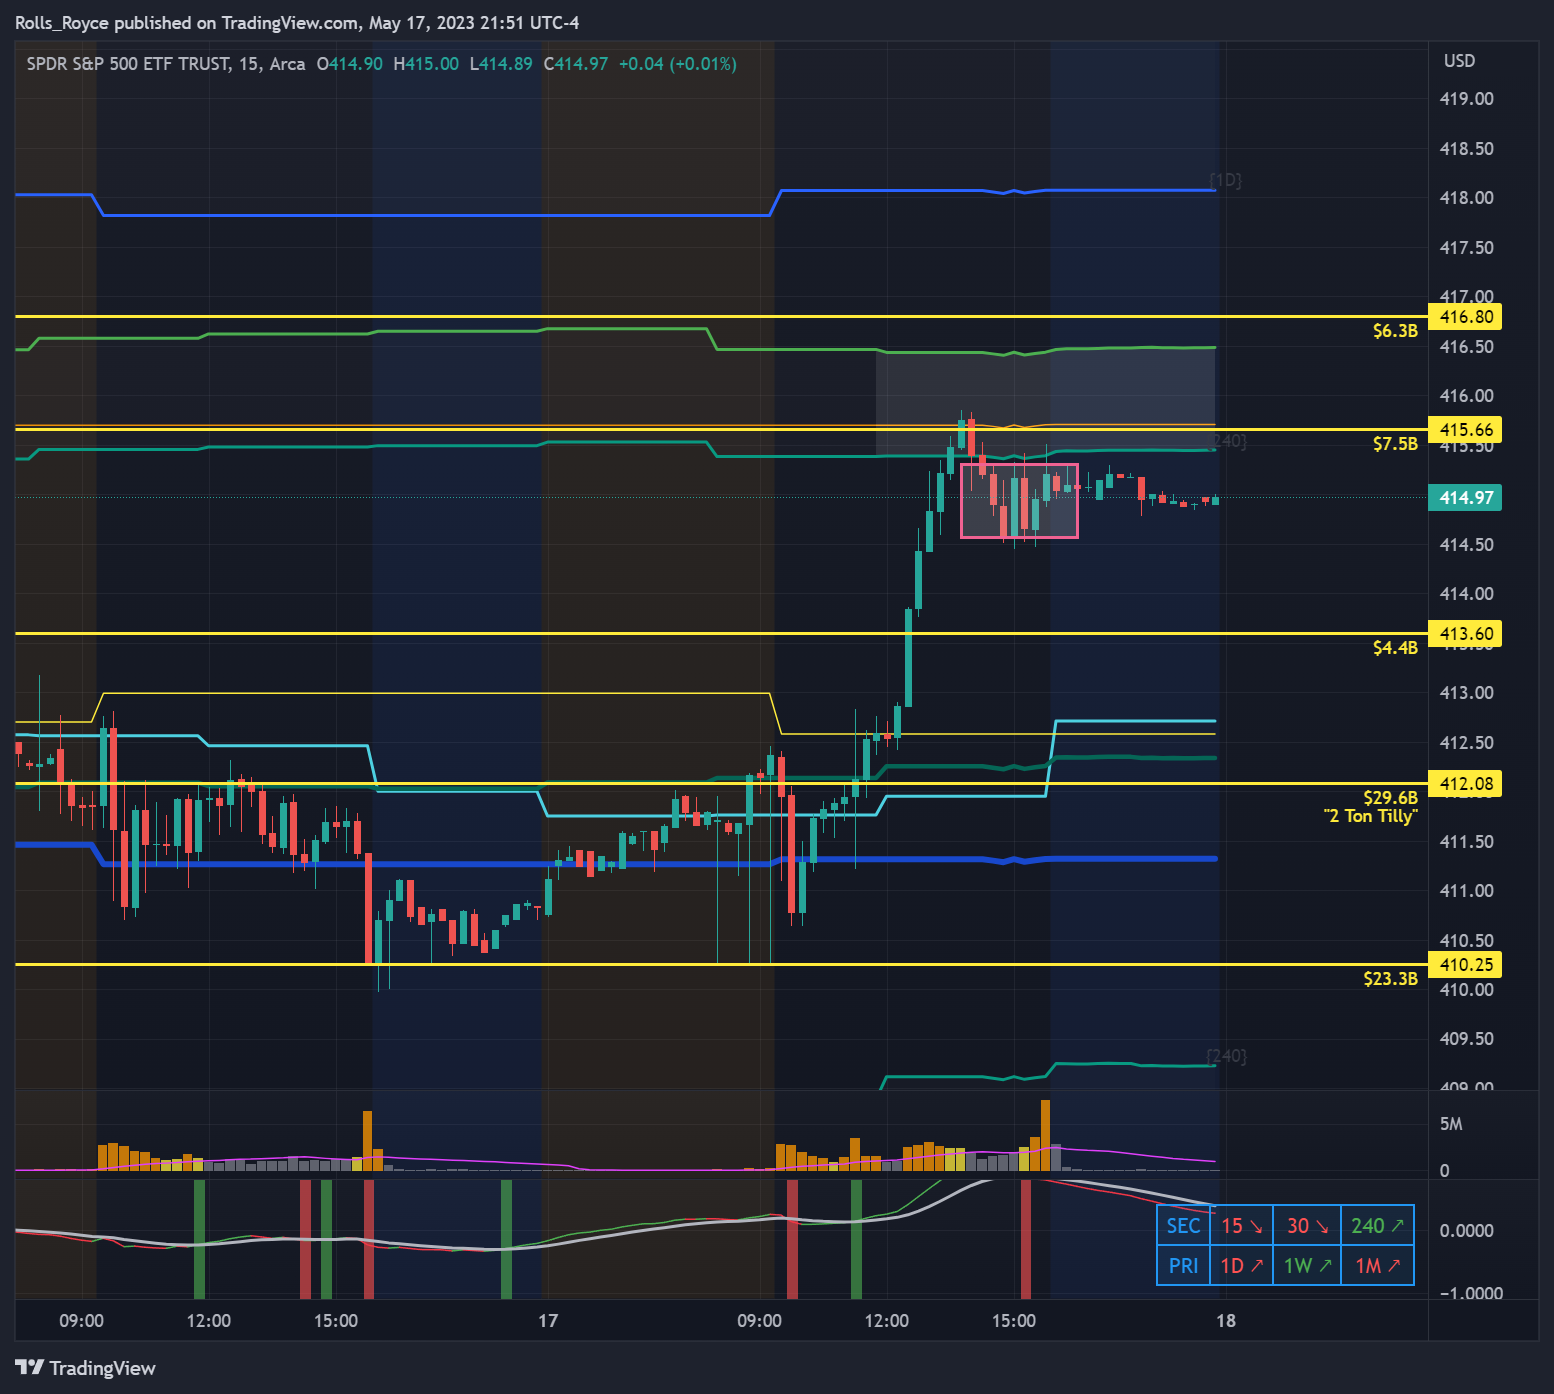
That’s why you need levels. Check out the chart below.
Notice the selloff in the morning on “2 Ton Tilly”, then a really odd news spike, and a test of the 20 day moving average. After the test, SPY starts zooming over “2 Ton Tilly”, which I’ve said over and over is the max important level.
Nimble traders made $3.50 on SPY today with this data.
Bias + Confirmation with Levels = High probability trade
I’ll talk a little more about those trades in the summary section, because there’s a caveat.
SPY PRINTS
Bullish, trades at the lows overtaking trades at the highs.

MACRO TREND
Strong uptrend day. Need to watch the close prints to see if they distributed at the highs.

QQQ PRINTS
Need some kind of nickname for a skinny level at 331, since the trade is a mere $448 million.

LARGE PRINTS
Normal volume.
Notice they are trading TLT with size.
Also pretty big IWM. I’ll draw those levels on a chart in a minute.
XLV trade is a little strange and out of place. The chart looks bullish, too. Sitting just under the 200. Hmmm.
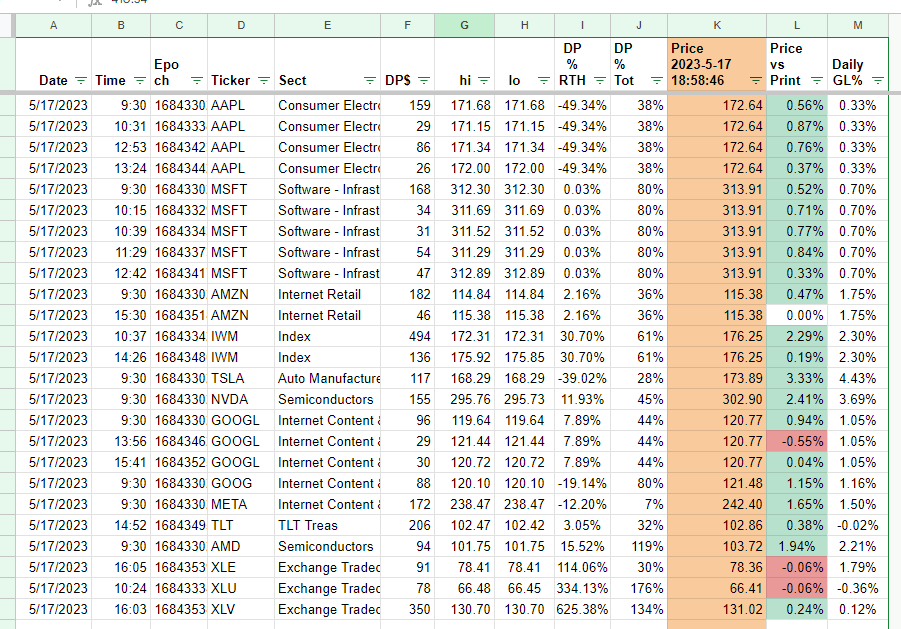
UNUSUAL PRINTS
Pretty hefty ETF trades here.


CLOSE PRINTS
Very high volume everything.

SUMMARY
SPY prints at the lows overtaking prints at the highs. Bullish.
QQQ has about the smallest trade I use for a level at the highs. Neutral.
Macro trend strong uptrend.
Realtime prints normal volume megacaps. Normal volume at the highs, no large trades at the lows. Neutral.
Notice the high volume IWM, SPY, TLT, & XLV trades. Those stand out.
Close prints high volume all megacaps. High volume close prints can mean selling the highs or “buying the way up”. The best way to tell is to draw a high volume trade box and watch how price reacts. Do we drop under the box or climb over? Check the SPY chart below.
The 2 days of unusual trades have a caveat where this rally may be short lived. Most of the volume is under $30 million. Lots of small trades. Easy to get in. Easy to get out. Yep, easy to get out.
Very good data tonight. Great levels. I spent about 2 hours writing this evening, and assembling the newsletter is so much easier without a headache.
Rolls
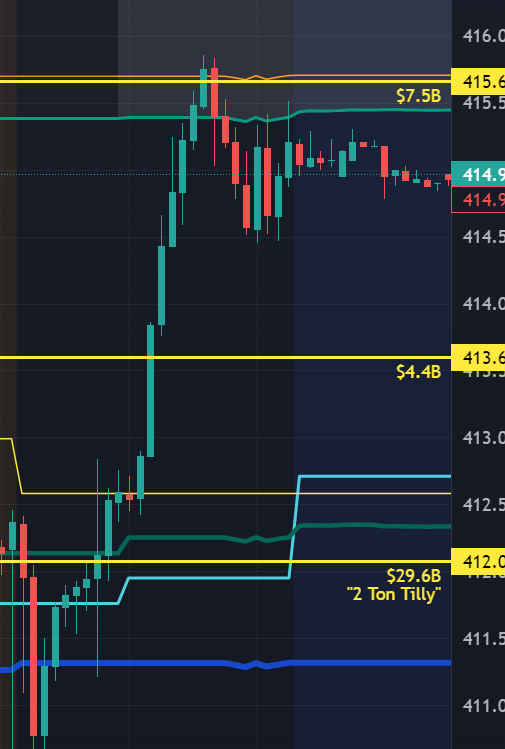
SPY
High volume trade box drawn in. Watch to see if we climb over or drop.
QQQ

IWM
Check out the large base.
