Intro
Friday
SPY has another very large trade at the lows and also > $10B volume. Both trade clusters are roughly in the same spot. 436 needs to hold for bulls. Repeat from Thursday: Many times > $10B volume on SPY at the lows means that a local low is close. The $5.8B trade at the lows is typically either: 1) short covering, where we’ll get a little rally that fails 2) buying, meaning a new trend starts. Of course, the trade could also be selling, and we keep going lower. That’s why I always say “watch levels”. We need to see price overtaking those levels, not just taking for granted that trades at the lows are buys.
QQQ has $3.7B of borderline trades sitting here. 358 needs to hold for bulls.
Macro trend indicative of dip buying. High volume day, so I’ll draw a high volume trade box on the SPY chart. Watch how price reacts to that box.
Realtime prints META $1.2B could be buying the lows.
Close prints have a few megacaps with high volume (AAPL MSFT). Same as Thursday: I’d much rather see more tickers with high volume before getting very bullish.
One other thing bothers me. Some of the charts I follow don’t look complete to the downside, especially AAPL & TSLA. Key levels like the 20 week moving average on SPY & QQQ have not been hit and are very close. I would trust levels more than a hunch though.
Monday
SPY and QQQ made higher lows today. SPY also rose over the high volume trade box.
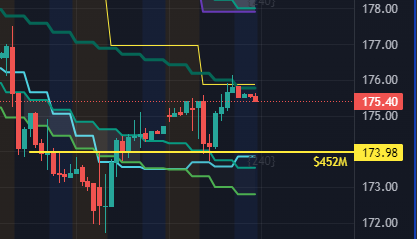
AAPL level from last Thursday worked well today.
Let’s see if the boys gave us any clues in the data.
SPY PRINTS
Not much here.
Keep reading with a 7-day free trial
Subscribe to RollsRoyce’s Darkpool Trading to keep reading this post and get 7 days of free access to the full post archives.


