Freebie: How to play the TSLA print I posted
So why in the heck did I post a TSLA chart today? Read on to find out.
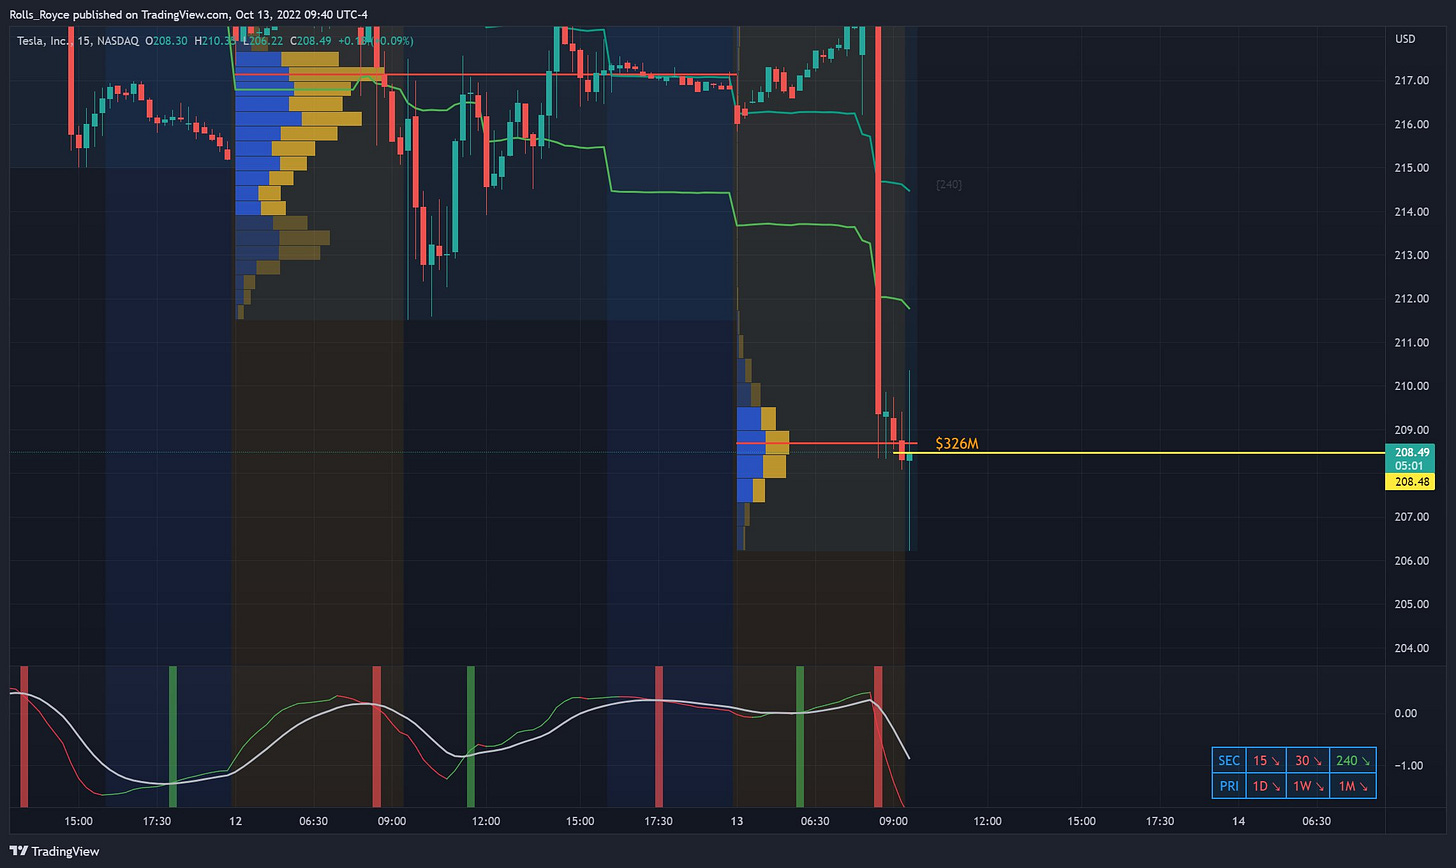
We dumped down pretty hard this morning and I see TSLA prints come in heavy. On my charts $326M means 326 million dollars came in at that spot. That is a lot right now for TSLA, so I got excited.
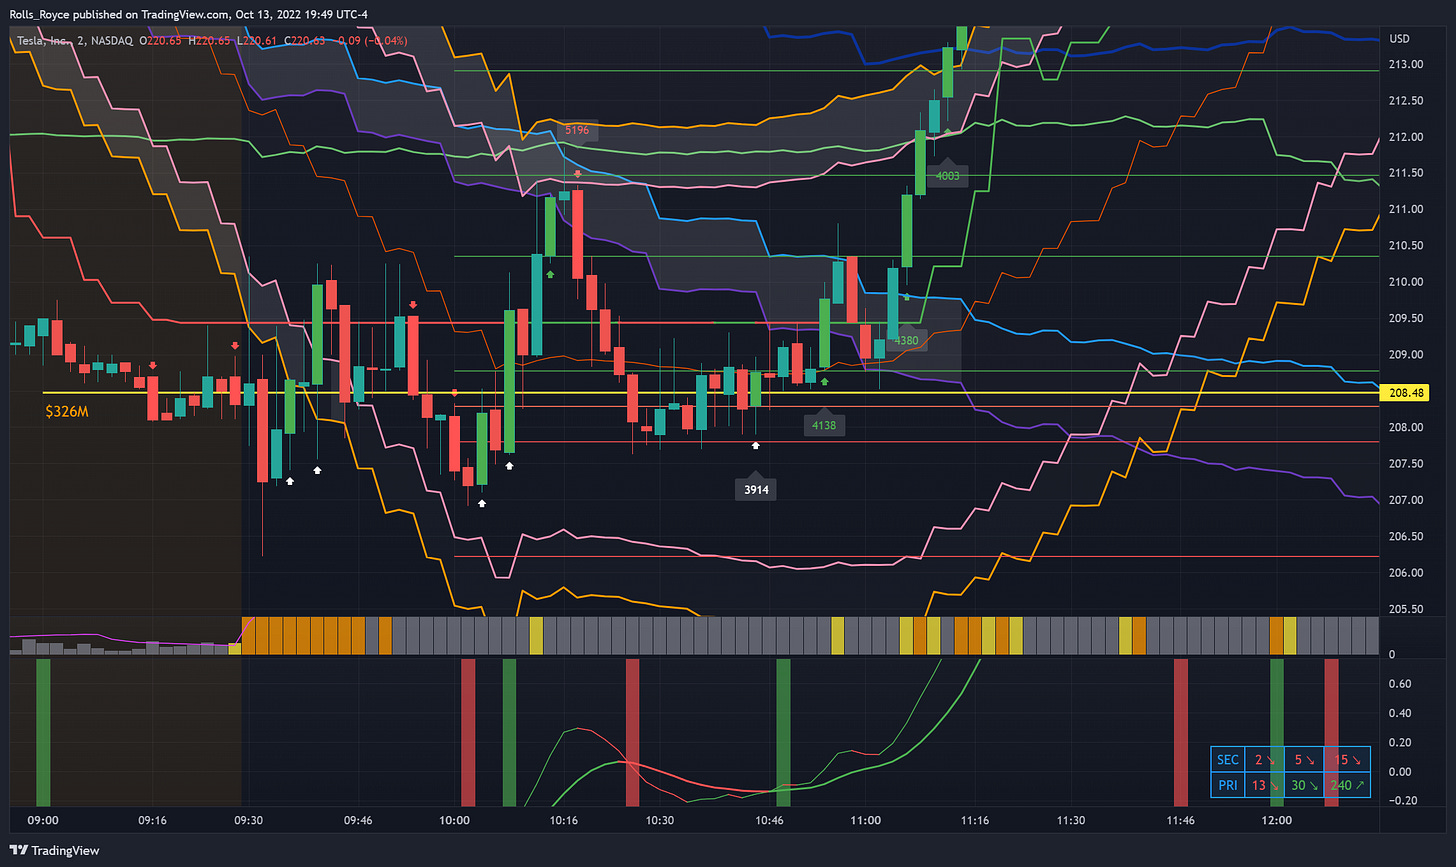
Look at that chart. TSLA dropped under, bounced off, dropped under again, bounced again and hugged the print for a while. Then it goes into outer space. They do this all the time. Everyone had a long time to buy this one, too. Look how long it stayed by the print.
How do you know if it’s going up or down? You don’t. That’s what risk management and technicals are for. An easy stop on this one is the 5 minute bottom kelt. Different tickers do different things. They have individual personalities, and they act differently when they are happy (bullish) or sad (bearish). You have to watch them over time.
OK, so how do you get these levels? Well, I couldn’t find a commercial darkpool scanner that I liked, so I wrote my own. It costs money (and time) to run these systems, so that why I ask a small fee for the substack. That fee is small compared to what I pay to keep it running.
If you are interested in scanning data for yourself, a couple of good commercial systems are in my email trailer.
https://www.volumeleaders.com/ This one is very economical and has near real time darkpool data and analytics.
https://www.flowtrade.com Real time darkpool data with a trading community and algo flow (more expensive).


